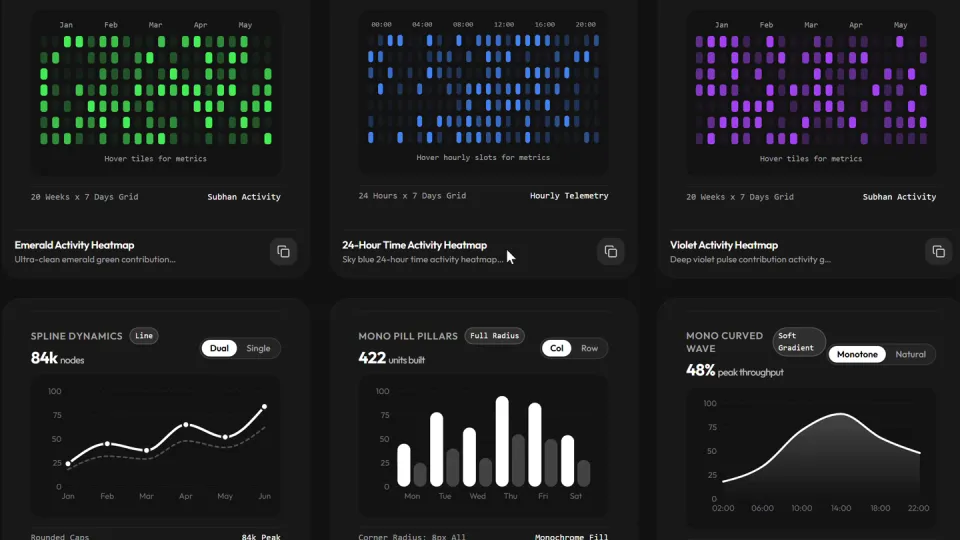
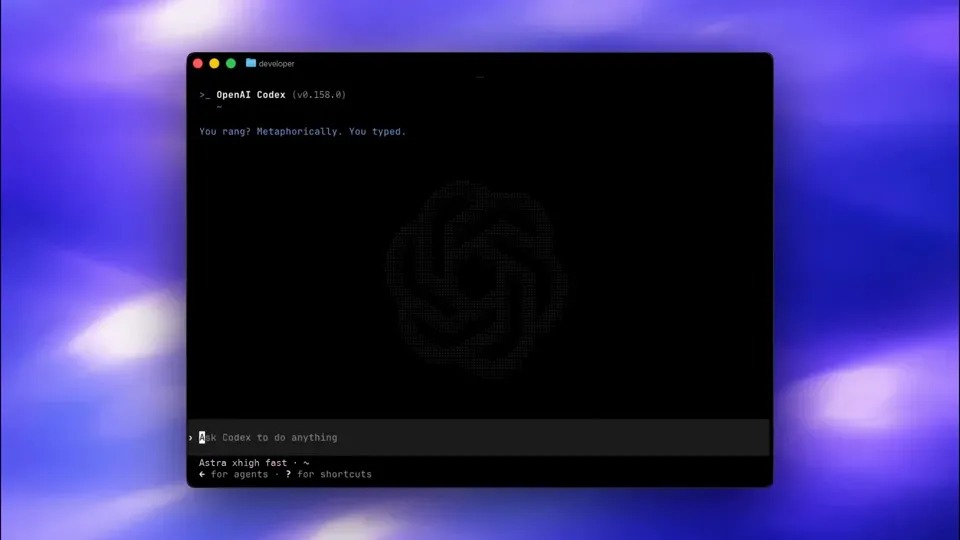
SVG Charts — animated React charts from the CLI
- About
- SVG Charts is a collection of minimal, animated chart components for React. Add interactive charts with a single CLI command. Open source, part of Spectrum UI.
- Product
- SVG Charts
- Company
- Spectrum UI
- Category
- Developer tools
- Posted
- Sep 12, 2026
- Duration
- 1:12
- Views on X
- 17,300snapshot Sep 14, 2026
- Author
- @arihantCodes
- Original
- View on X
- Tags
- svg-charts · react · spectrum